Complex Corrections: Zigzags, Flats, Triangles, & Combinations
Learner: I understand basic corrections now, but I keep hearing about complex corrections. What makes them different from simple ABC patterns?
Tutor: Complex corrections are like a symphony compared to the simple melody of ABC patterns. They combine multiple simple corrective patterns to create larger structures. These formations often occur during periods of significant market indecision or when price needs to move sideways for an extended time.
Learner: So they’re basically combinations of the patterns we already know?
Tutor: Exactly. Complex corrections typically take one of these forms:
- Double Three: Two simple corrective patterns connected by another correction
- Triple Three: Three simple corrective patterns linked by connecting waves
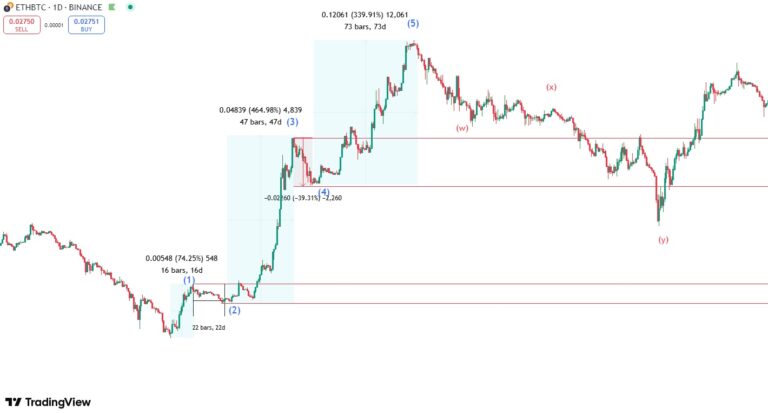
- Double Zigzag: Two zigzag patterns connected by a correction
- Triple Zigzag: Three zigzag patterns linked by corrections
Learner: Could you break down each type in more detail?
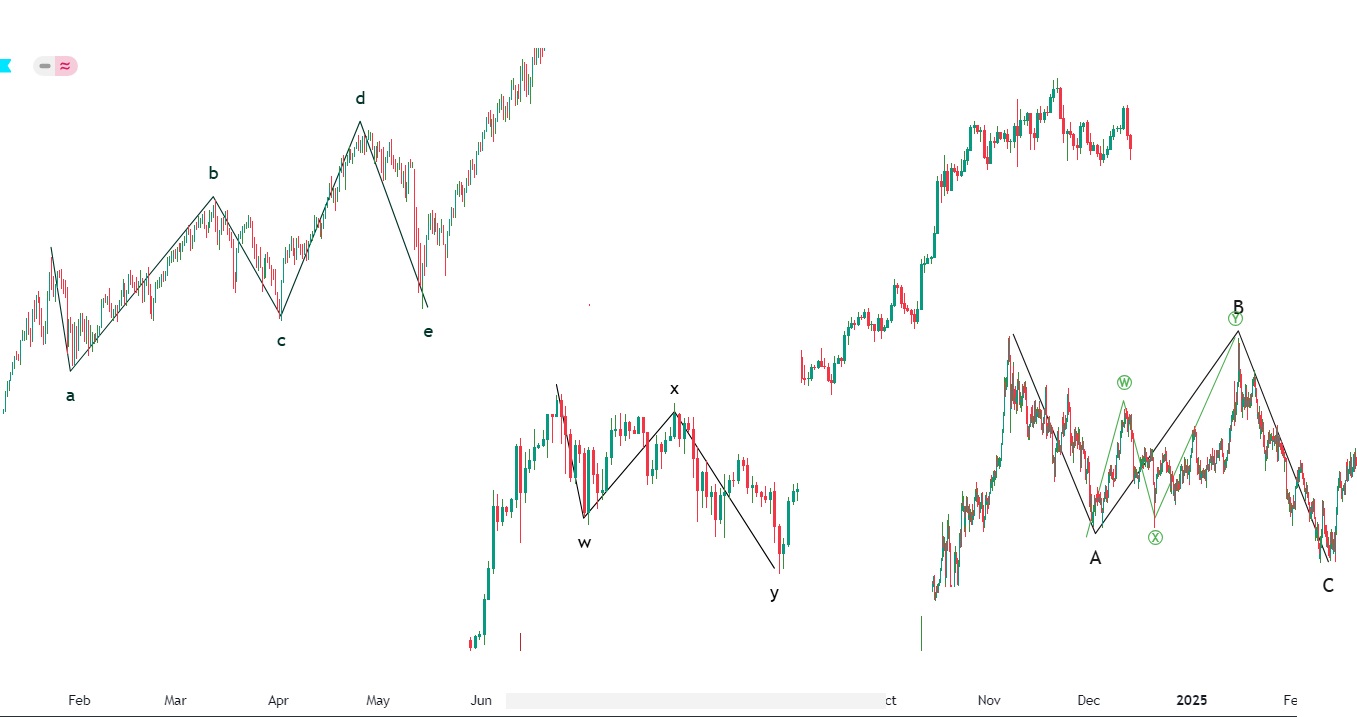
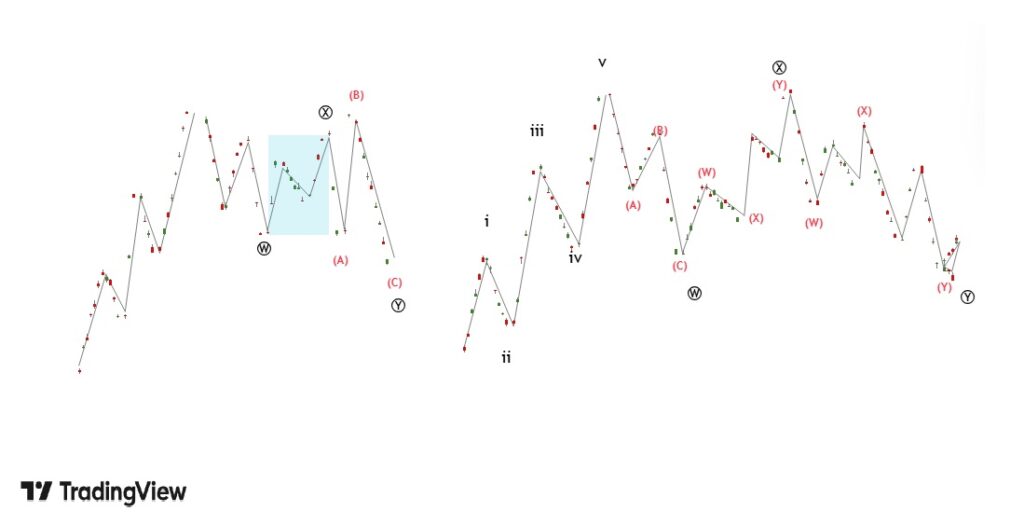
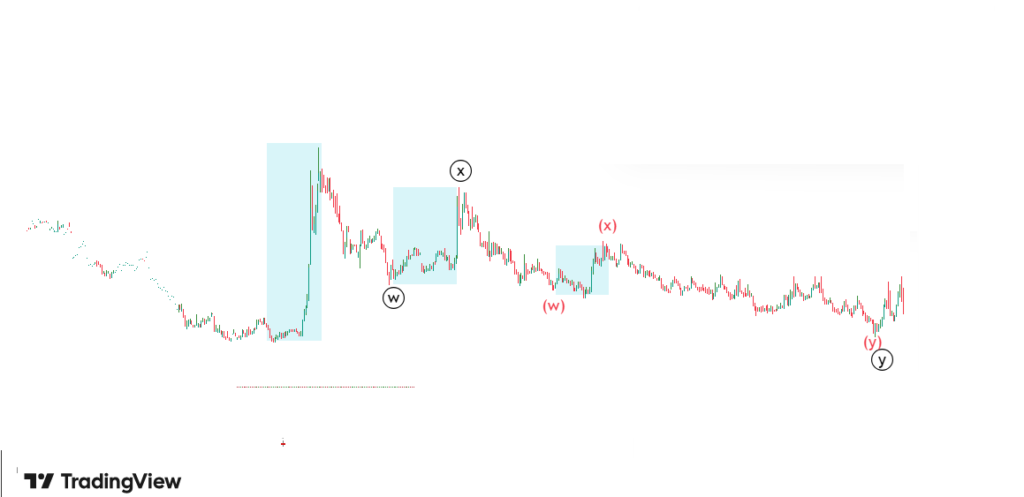
Tutor: Let’s start with Double Three patterns. Imagine you have a zigzag pattern followed by a flat pattern, connected by what we call an “X” wave. The formula would look like this: Zigzag + X wave + Flat = Double Three
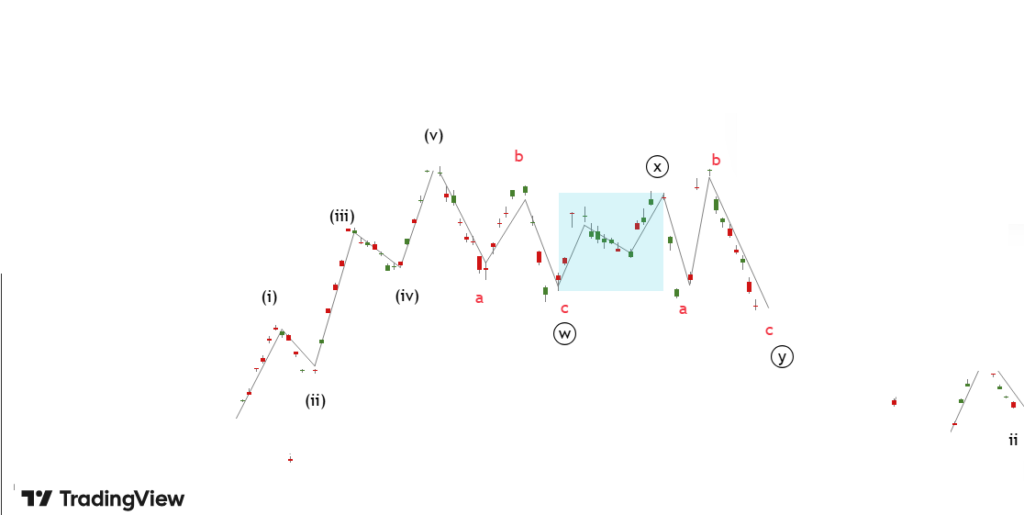
Each component maintains its own internal structure, but they work together to create a larger sideways movement.
Learner: What about triangles? Where do they fit in complex corrections?
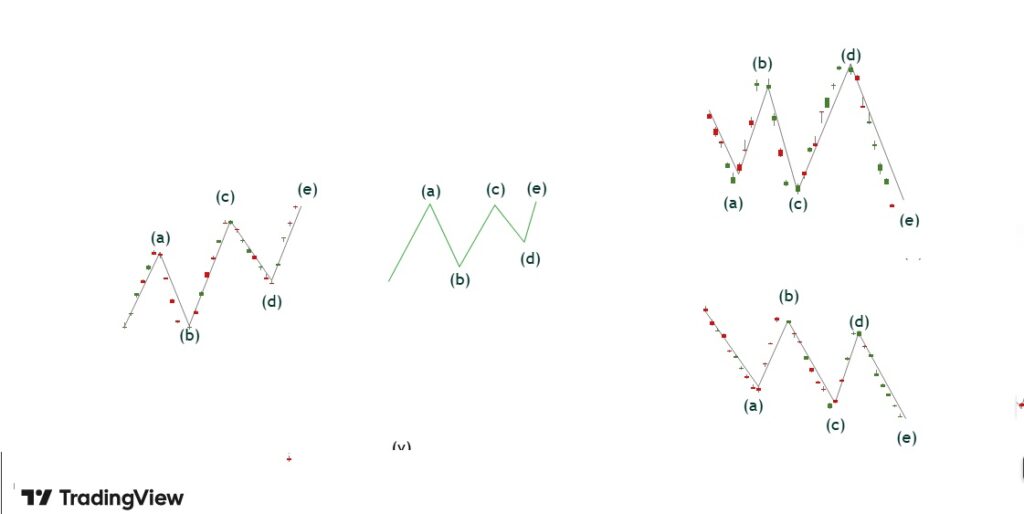
Tutor: Triangles are fascinating patterns that often appear in complex corrections. They come in several varieties:
- Contracting Triangles (most common)
- Expanding Triangles
- Ascending Triangles
- Descending Triangles
The key characteristic of any triangle is that it contains five internal waves labeled A-B-C-D-E, each subdividing into threes.
Learner: How can we identify when a correction is becoming complex?
Tutor: There are several key indicators:
- The correction extends longer than expected
- Price action becomes increasingly choppy
- The market fails to break key support/resistance levels
- Volume patterns show sustained low activity
- Technical indicators suggest continued consolidation
Learner: Are there specific market conditions that tend to produce complex corrections?
Tutor: Yes, complex corrections often appear in these situations:
- During major trend transitions
- In ranging markets
- Before significant news events
- At key market turning points
- During periods of low volatility
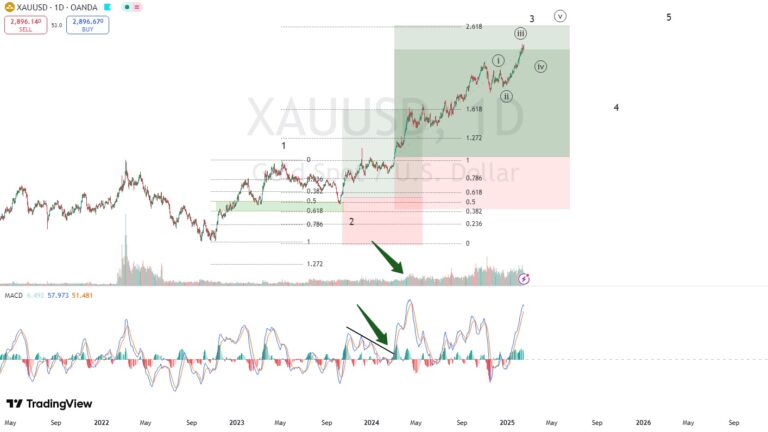
They’re particularly common in the fourth wave position of larger impulse patterns and in wave B of larger corrections.
Learner: What about trading these patterns? They seem complicated.
Tutor: Trading complex corrections requires patience and a systematic approach. Here’s a reliable strategy:
- Identify the larger trend context
- Recognize the initial corrective pattern
- Watch for connecting X waves
- Monitor pattern completion indicators
- Prepare for the eventual trend resumption
Remember, complex corrections are often better for positioning than active trading.
Learner: Could you explain more about X waves?
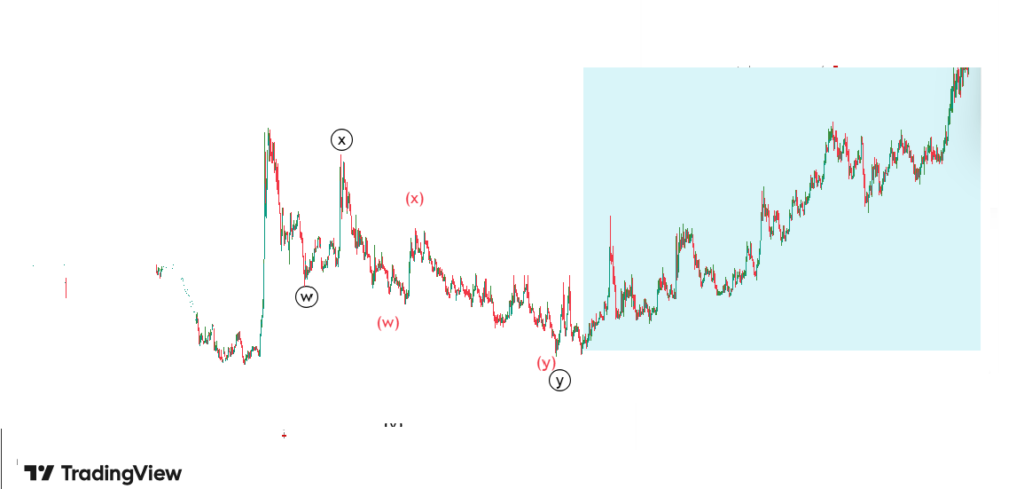
Tutor: X waves are crucial connecting patterns in complex corrections. They:
- Move in the direction of the larger trend
- Can be simple or complex themselves
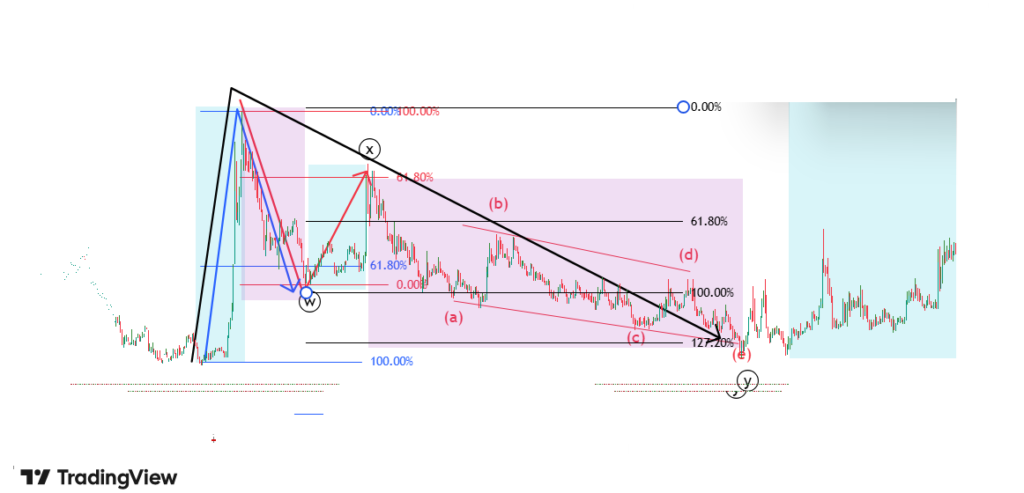
- Often reach specific Fibonacci retracement levels
- Help identify pattern boundaries
Learner: What role do Fibonacci relationships play in complex corrections?
Tutor: Fibonacci relationships are essential for measuring and validating complex corrections:
- Component waves often relate by ratios of 0.618, 1.000, or 1.618
- X waves typically retrace 38.2% to 61.8% of the previous pattern
- The entire complex correction often relates to the previous impulse wave by Fibonacci ratios
- Time relationships between components often follow Fibonacci sequences
Learner: What are the most common mistakes traders make with complex corrections?
Tutor: The biggest pitfalls include:
- Trying to force simple pattern recognition onto complex structures
- Getting impatient and trading too early
- Missing pattern completion signals
- Overlooking the larger trend context
- Not considering multiple pattern possibilities
Key Takeaways:
- Complex corrections combine multiple simple patterns
- They often appear during periods of market indecision
- X waves connect the component patterns
- Fibonacci relationships help validate pattern structure
- Patience is crucial for trading these formations
- Understanding market context is essential
- Pattern recognition requires systematic analysis
Questions About Complex Corrections:
- What is a complex correction in Elliott Wave Theory? A complex correction is a combination of multiple simple corrective patterns connected by X waves, typically forming double or triple threes, zigzags, or various triangle patterns.
- How long do complex corrections typically last? Complex corrections can last significantly longer than simple corrections, often taking weeks or months to complete depending on the trading timeframe.
- What are the most common types of complex corrections? The most common types are double threes, triple threes, double zigzags, and various triangle formations.
- How can traders identify complex corrections? Traders can identify complex corrections through extended sideways price action, multiple ABC patterns, connecting X waves, and specific Fibonacci relationships.
- What tools are best for analyzing complex corrections? Key tools include Fibonacci retracement levels, volume analysis, pattern recognition software, and multiple timeframe analysis.