Understanding Corrective Waves – A Natural Market Rhythm
Learner: We’ve covered the five-wave impulse pattern, but markets don’t always move in that direction. Can you explain what happens during corrective waves?
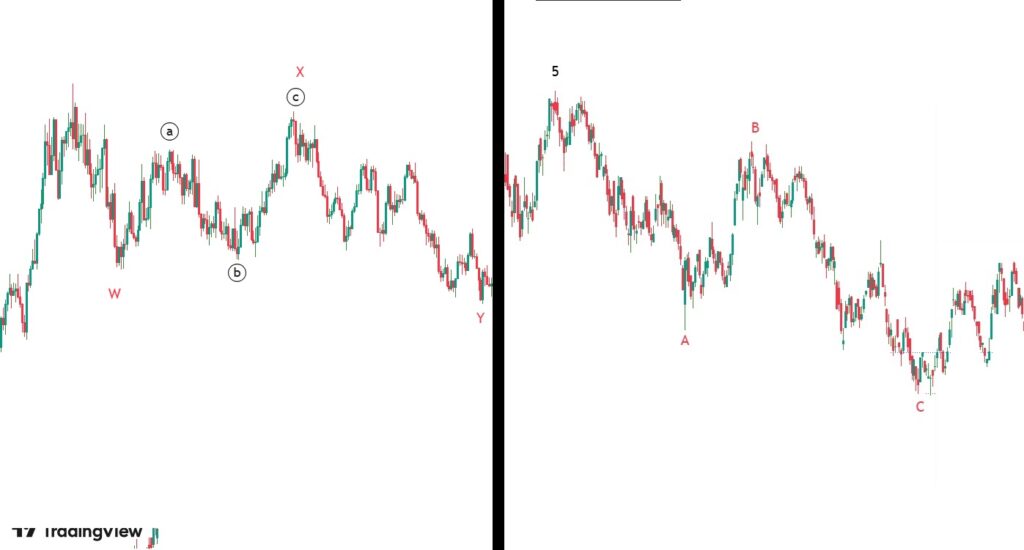
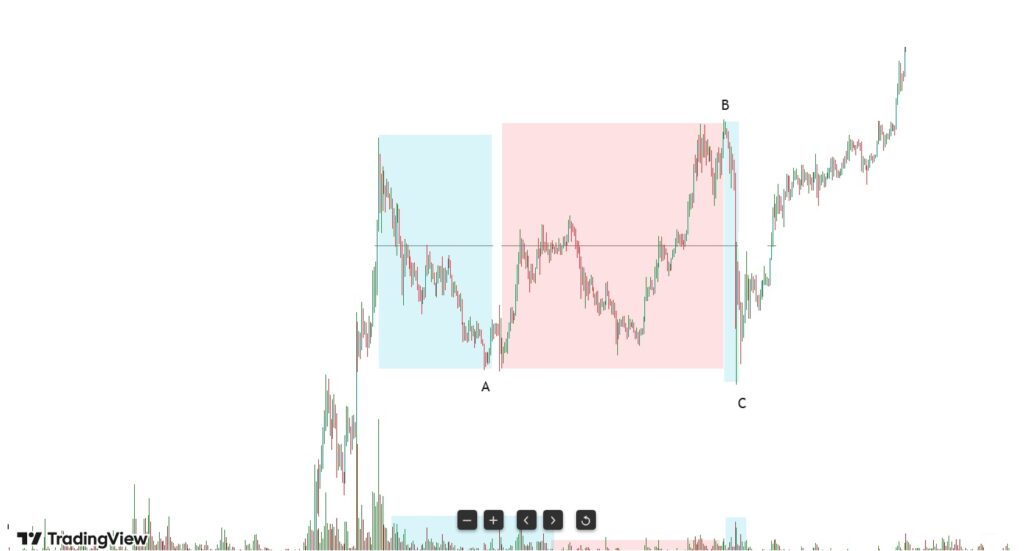
Tutor: Excellent question. Corrective waves are just as important as impulse waves, perhaps even more challenging to navigate. Think of them as the market’s way of “catching its breath” after a strong directional move. They’re called corrective waves because they move counter to the larger trend, correcting or retracing part of the previous impulse move.
Learner: So they’re basically just three waves moving in the opposite direction?
Tutor: While the basic pattern is three waves – labeled A, B, and C – corrective waves are actually more complex than impulse waves. They come in several variations and can be quite tricky to identify in real-time. The key is understanding that corrections are working against the larger trend, which creates more variety in their structure.
Learner: What makes them more complex than impulse waves?
Tutor: Unlike impulse waves, which generally follow a more straightforward five-wave structure, corrective waves can take multiple forms:
- Simple corrections (Zigzag, Flat, Triangle)
- Complex corrections (Double and Triple combinations)
- Hybrid patterns
Each of these has distinct characteristics and follows specific rules. The market’s psychology during corrections is more uncertain, which creates these varied patterns.
Learner: Could you break down the simple corrections first?
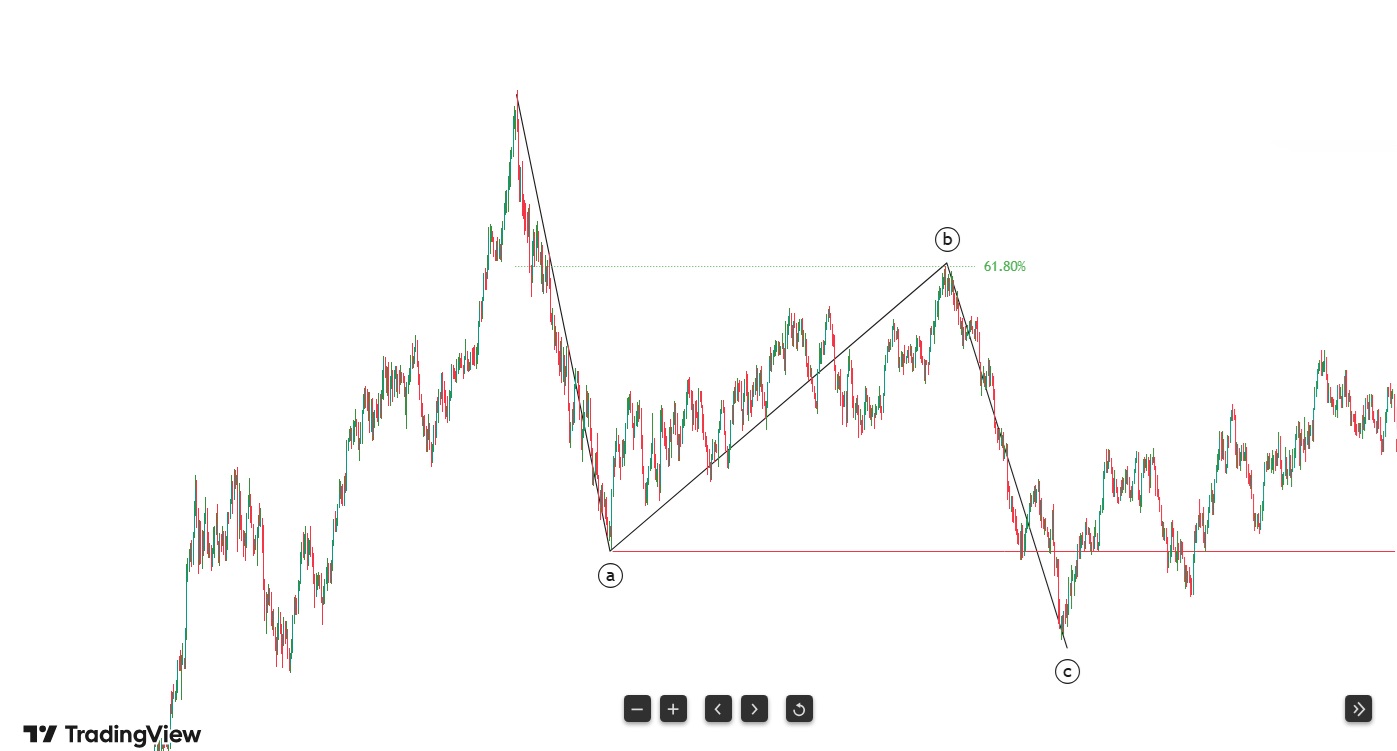
Tutor: Let’s start with the most common type – the Zigzag pattern. In a Zigzag:
- Wave A is a five-wave structure moving against the trend
- Wave B is a three-wave structure retracing Wave A
- Wave C is another five-wave structure in the same direction as Wave A
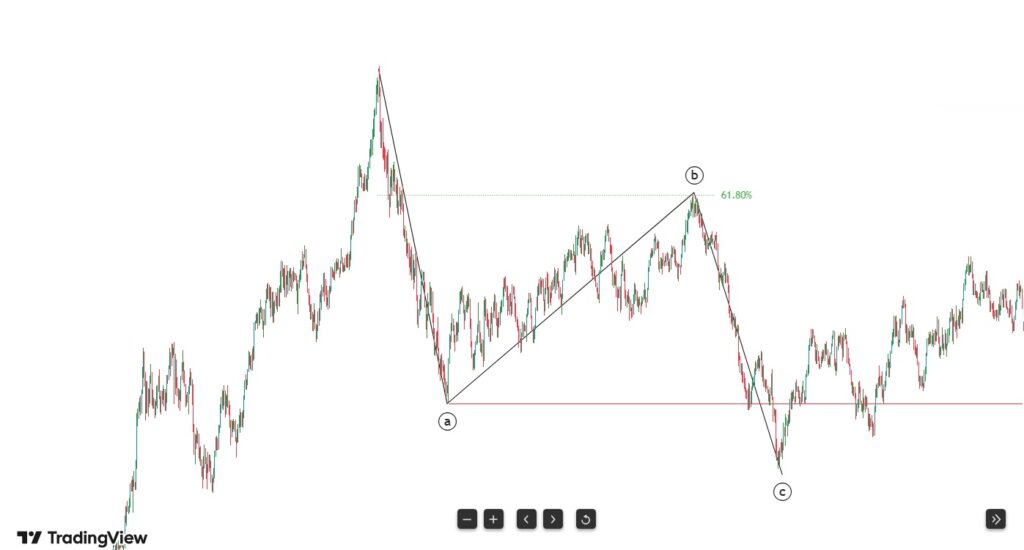
The key characteristic of a Zigzag is that Wave B typically retraces less than 61.8% of Wave A, and Wave C often extends beyond the end of Wave A.
Learner: What about Flat patterns? How are they different?
Tutor: Flat patterns are fascinating because they show more equality between waves. In a regular Flat:
- Wave A is a three-wave structure
- Wave B retraces 90% or more of Wave A
- Wave C is a five-wave structure approximately equal to Wave A
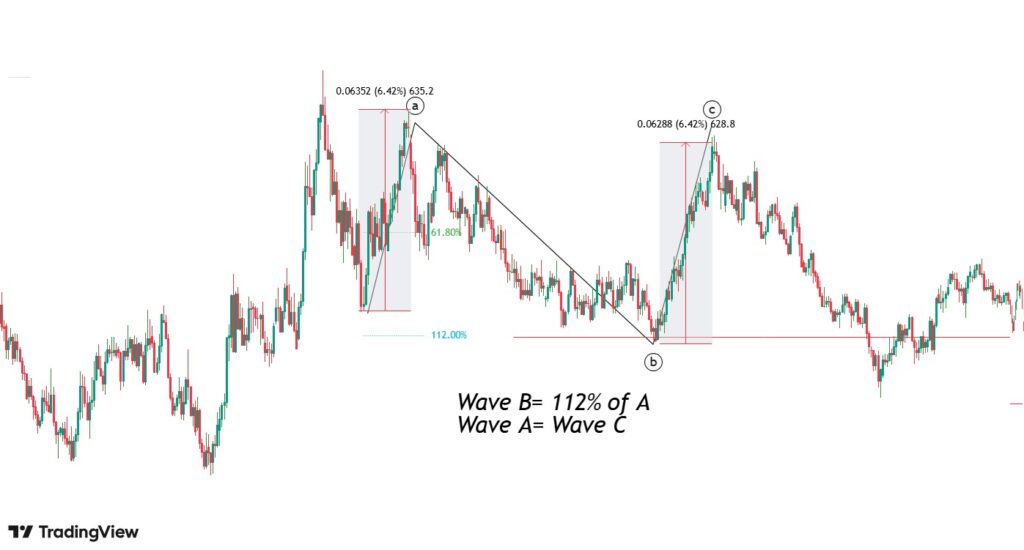
There are also variations like Expanded Flats and Running Flats, where these relationships vary in specific ways. The key is that Flats generally show more sideways movement than Zigzags.
Learner: You mentioned Fibonacci relationships. How do they apply to corrective waves?
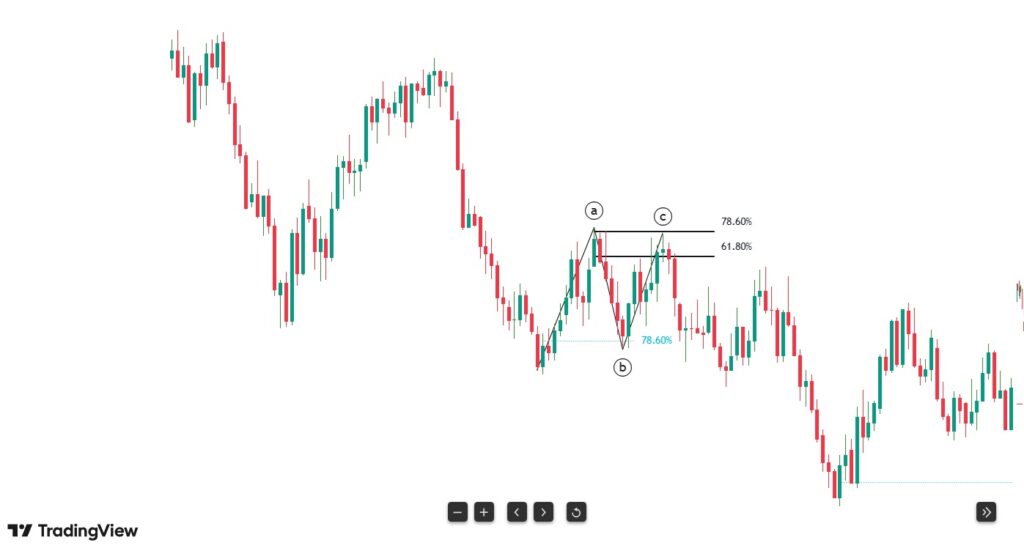
Tutor: Fibonacci ratios are crucial in corrective wave analysis. The most common relationships we look for are:
- Wave B typically retraces 61.8% or 78.6% of Wave A
- Wave C often extends to 61.8%, 100%, or 161.8% of Wave A
- In complex corrections, the entire pattern often relates to the previous impulse wave by these same ratios
These relationships help us project potential turning points and validate our wave count.
Learner: What are the common mistakes traders make with corrective waves?
Tutor: The biggest pitfalls include:
- Mistaking the end of Wave B for the end of the entire correction
- Assuming all corrections will be simple ABC patterns
- Getting too focused on exact Fibonacci levels without considering the broader context
- Failing to recognize when a correction is developing into a complex pattern
Remember, corrections are about probability, not certainty. The market can always develop more complex patterns than initially anticipated.
Learner: How can we improve our accuracy in identifying corrective waves?
Tutor: Here’s a systematic approach:
- First, identify the larger trend context
- Look for characteristic wave structures (threes vs fives)
- Apply Fibonacci retracement tools
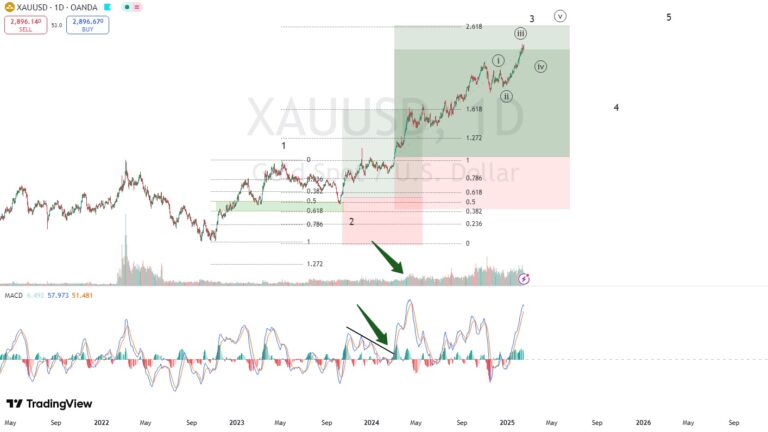
- Monitor volume patterns (corrections typically show declining volume)
- Watch for pattern completion signals
- Always consider alternative counts
Most importantly, maintain flexibility in your analysis. Corrections can morph from one pattern to another, so staying adaptable is crucial.
Learner: What role does volume play in corrective waves?
Tutor: Volume typically decreases during corrections, which makes sense psychologically. During impulse waves, there’s clear directional conviction, but corrections represent uncertainty and consolidation. You’ll often see:
- Declining overall volume through the correction
- Lower volume in Wave B compared to Waves A and C
- A volume spike near the end of Wave C, signaling potential completion
Learner: Any final wisdom about trading corrective waves?
Tutor: Yes, and this is crucial: Corrections are often better opportunities for positioning than for active trading. They’re the market’s way of building energy for the next impulse move. The best strategy is usually to:
- Identify the correction early
- Determine its most probable pattern
- Wait for completion signals
- Position yourself for the next impulse wave
Remember, patience during corrections often leads to better opportunities than trying to trade every minor movement.
Key Takeaways:
- Corrective waves move against the larger trend in three main waves
- They come in simple and complex variations
- Fibonacci relationships help validate wave counts
- Volume typically decreases during corrections
- Patience and pattern recognition are crucial for trading success
- Always consider the larger trend context
- Be prepared for patterns to develop more complexity