Reddit Stock Analysis: Elliott Wave Theory Predicts Potential Price Movements
Content
- Introduction: Understanding Reddit’s Stock Journey
- Elliott Wave Theory: The Foundation of Our Analysis
- Identifying Reddit’s Current Wave Structure
- Scenario 1: Deeper Correction Before Final Push (Most Likely)
- Scenario 2: Shallow Correction and Continued Bull Run
- Technical Factors Supporting Our Analysis
- Conclusion: Navigating Reddit Stock’s Future
Understanding Reddit’s Stock Journey
Reddit’s stock has been on a fascinating journey since its IPO in March 2024. In this comprehensive analysis, we’ll examine the current price action through the lens of Elliott Wave Theory, a powerful technical analysis framework that helps identify market cycles and predict potential future movements. By carefully analyzing the wave structure that has formed over the past several months, we can identify two possible scenarios for Reddit’s stock price in the coming months.

Elliott Wave Theory: The Foundation of Our Analysis
Elliott Wave Theory proposes that market prices move in predictable patterns of five impulsive waves in the direction of the main trend, followed by three corrective waves against the trend. Each wave has specific characteristics and follows certain rules that help analysts identify where we are in the cycle.
For those unfamiliar with Elliott Wave principles, understanding the alternation principle is crucial for our analysis. This principle suggests that if wave two is simple, wave four will be complex (or vice versa), and if wave two is short in time, wave four will typically take longer to develop.
Identifying Reddit’s Current Wave Structure
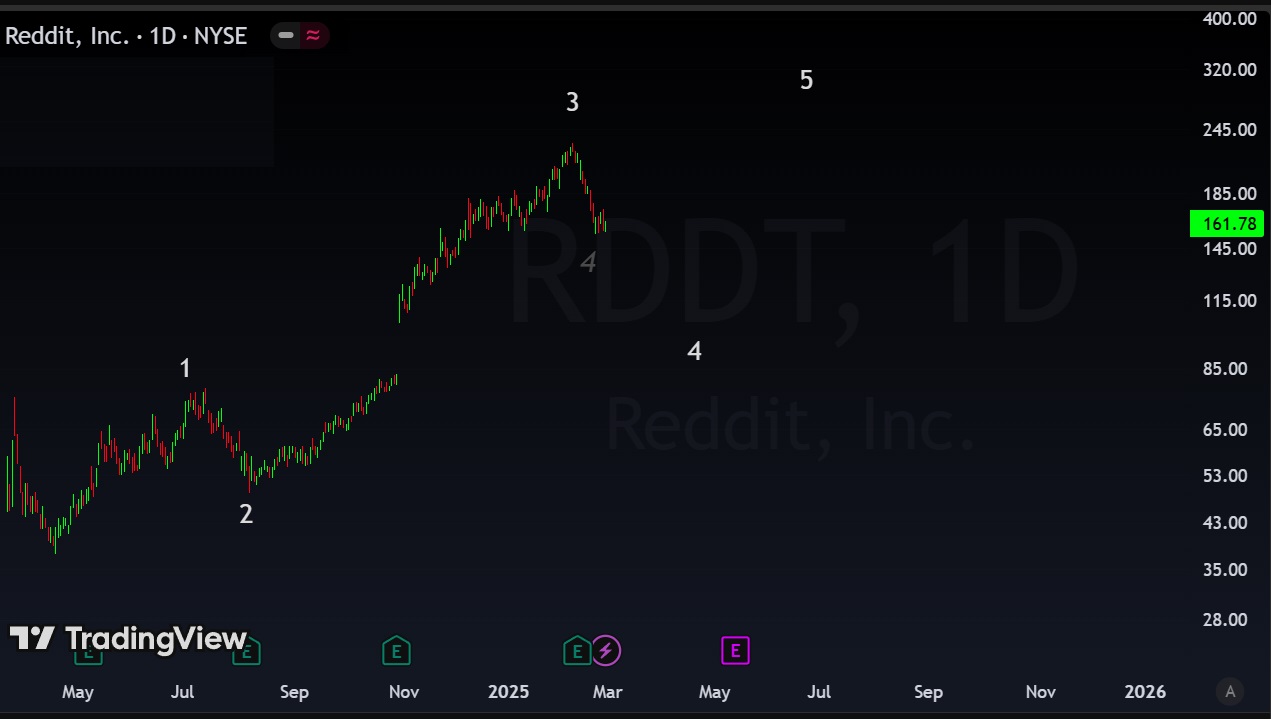
Based on this analysis, here’s how Reddit’s stock has potentially moved through the Elliott Wave pattern:
- Wave 1: Started April 18, 2024, and completed July 15, 2024 (approximately 3 months of upward movement)
- Wave 2: Began July 15, 2024, and concluded August 7, 2024 (a relatively short 3-week correction)
- Wave 3: Initiated around August 7, 2024, and likely finished February 10, 2025 (a powerful 6-month uptrend)
- Wave 4: Currently in development (correction phase)

Scenario 1: Deeper Correction Before Final Push (Most Likely)
The alternation principle suggests the first scenario might be more complex. Since wave 2 was notably short in duration (only about 3 weeks), wave 4 could potentially take significantly longer to develop and retrace deeper.
In this scenario, we might see:
- Initial upward movement that proves to be corrective rather than the start of wave 5
- Resumption of the downtrend with potential targets at:
- 38.2% retracement level
- 50% retracement level
- Most likely, a 61.8% retracement (the golden ratio), which coincides with a bullish gap between $83 and $104 that remains unfilled
This deeper correction could extend until approximately March 6, 2025, or possibly as late as April 8, 2025, before wave 5 begins its upward journey.

Scenario 2: Shallow Correction and Continued Bull Run
The second scenario assumes that the current wave 4 will only retrace 23.6% of the preceding wave 3. This shallow correction would be typical in strong bull markets and would set the stage for a final wave 5 push to new all-time highs.
If this scenario plays out, we can expect:
- Wave 4 to find support relatively quickly near current levels
- A resumption of the uptrend with wave 5 potentially reaching targets of:
- $230 (conservative target)
- $400 (moderate target)
- $700 (aggressive target if extended fifth wave develops)
This bullish case is predicated on the accuracy of the wave count and would be invalidated if the price breaks below the $78 level, which represents a critical support point according to Elliott Wave rules.

Technical Factors Supporting This Analysis
Several technical factors lend credence to our Elliott Wave count:
- Volume Patterns: Wave 3 showed increasing volume during upward movements, a classic characteristic of third waves in Elliott Wave Theory
- Momentum Indicators: RSI and MACD patterns align with typical wave 3 exhaustion signals
- Unfilled Gap: The price gap between $83 and $104 represents a high-probability target for wave 4, as markets often “fill gaps” during corrective phases
- Fibonacci Relationships: The projected wave 5 targets maintain Fibonacci relationships with previous waves, adding validity to our count
Navigating Reddit Stock’s Future
While Elliott Wave Theory provides a framework for understanding potential price movements, investors should remain vigilant for signs that might invalidate either scenario. Breaking below $78 would require a complete reassessment of the wave count.
For investors considering positions in Reddit stock:
- The primary scenario suggests maintaining long positions with stops below $78
- The secondary scenario indicates potential for establishing new long positions near the 61.8% retracement level (approximately $84-104 range)
- In either case, wave 5 potentially offers significant upside potential, particularly if it extends as fifth waves sometimes do
Remember that technical analysis, including Elliott Wave Theory, is probabilistic rather than deterministic. Always implement proper risk management strategies alongside any technical forecasts.
For a deeper understanding of how Elliott Wave patterns develop and interact with market psychology, explore our detailed guide on wave movement patterns and market cycles.
NOT A FINANCIAL ADVICE!