Market Structure with Elliott Wave Theory: Timeframes, Degrees, and Cycles
In today’s discussion:
- Why Different Timeframe Analysis is Crucial
- Starting with the Larger Timeframe
- Finding Opportunities in Smaller Timeframes
- Decoding Wave Degrees: The Hierarchy of Market Movements
- Commonly Used Wave Degrees
- Identifying Wave Degrees: Time, Price, and Structure
- The Role of Market Cycles in Elliott Wave Analysis
- Understanding Macro Trends
- Combining Multiple Degrees for High-Probability Setups
- Finding Alignment Across Timeframes
- Fibonacci Confluence Across Degrees
- Common Mistakes to Avoid in Market Structure Analysis
- Summary: Key Takeaways for Mastering Market Structure
- Final Thoughts: Becoming a Proficient Wave Analyst
Learner: I’m starting to grasp the individual wave patterns. But I’m struggling to put it all together. How do I connect what I see on a short-term chart with the bigger picture? It feels like I’m missing the forest for the trees.
Tutor: That’s a very common challenge, and it’s precisely where understanding market structure comes in. You’re right – focusing solely on individual wave patterns is like examining individual brushstrokes without seeing the entire painting. Market structure, in the context of Elliott Wave Theory, is about understanding how waves of different sizes relate to each other across various timeframes and how they fit within broader market cycles. It’s about seeing the hierarchy of price movement.
The Importance of Different Timeframe Analysis
Tutor: Imagine you’re a ship captain. You wouldn’t navigate solely using a close-up map of the immediate harbor, would you? You’d also need a larger-scale chart showing the coastline, prevailing winds, and potential hazards. Similarly, in trading and investing, you need to analyze multiple timeframes to get a complete picture of the market.
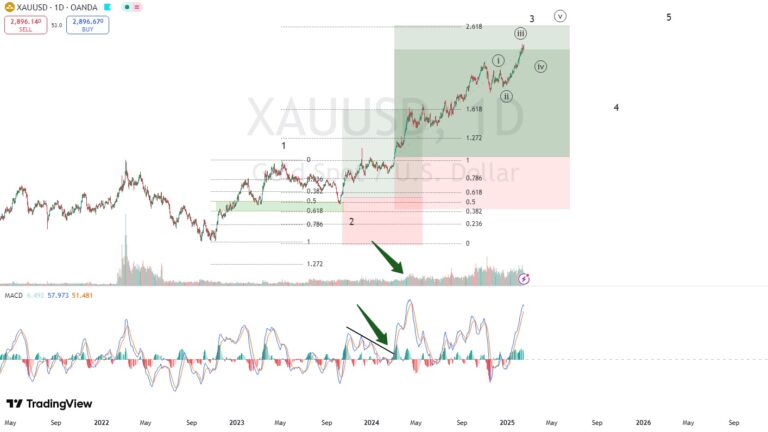
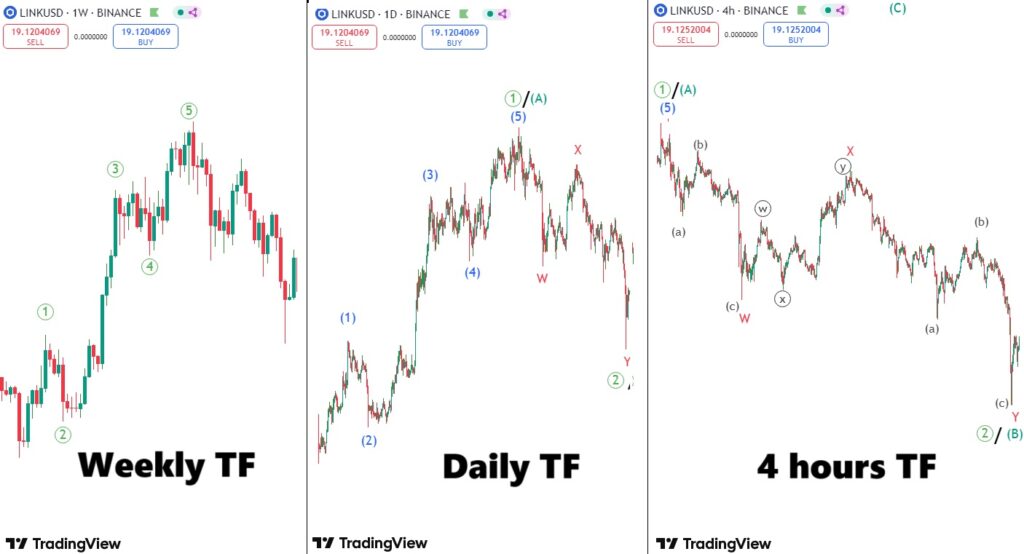
The fundamental principle is to start with the larger timeframe and work your way down. This establishes the dominant trend. A bullish trend on a weekly chart provides the context for interpreting price action on a daily or hourly chart. If the weekly chart shows a clear impulse wave up, you’d generally be looking for buying opportunities on smaller timeframes, anticipating that dips are corrections within the larger uptrend.
Learner: So, a correction on a daily chart might be a buying opportunity if the weekly chart is bullish?
Tutor: Exactly! It’s all about perspective. What looks like a significant decline on a smaller timeframe might be a minor pullback within a larger upward move. This is why it’s crucial to understand the relationship between timeframes. A completed five-wave decline on an hourly chart might be just Wave A of a larger ABC correction on the daily chart.
Understanding Wave Degrees
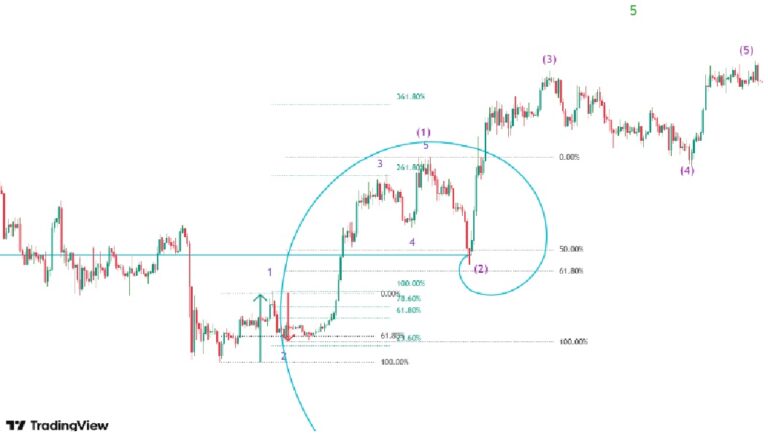
Tutor: Elliott Wave Theory uses a system of wave degrees to categorize waves of different sizes. Think of it as a labeling system that helps you organize the fractal, self-similar nature of market movements. These degrees aren’t rigid definitions, but rather guidelines to help you understand the relative size and significance of each wave.
Here’s a simplified breakdown of the most commonly used degrees:
Grand Supercycle: Multi-century trends.
Supercycle: Multi-decade trends.
Cycle: Multi-year trends (often associated with business cycles).
Primary: Several months to a few years.
Intermediate: Weeks to months.
Minor: Days to weeks.
Minute: Hours to days.
And even smaller…
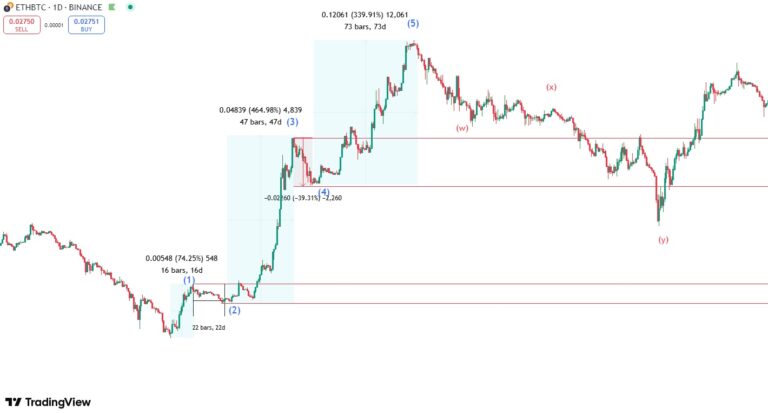
The key is to recognize that each wave of a particular degree is composed of smaller waves of the next lower degree. An Intermediate degree Wave 3, for example, will be made up of five Minor degree waves. Those Minor waves, in turn, will be composed of Minute degree waves, and so on. This “nesting” of waves is what creates the fractal pattern.
Learner: How do I determine the correct degree of a wave? It seems subjective.
Tutor: It does involve some judgment, but it’s not entirely subjective. There are three primary factors to consider:
Time: How long did the wave take to develop? A wave that unfolds over several months is likely of a higher degree than a wave that completes in a few hours.
Price Magnitude: How large was the price movement? Larger price swings generally correspond to higher-degree waves.
Internal Structure: This is the most crucial aspect. The wave must adhere to the rules and guidelines of Elliott Wave Theory. A purported Wave 3 of Intermediate degree must subdivide into five Minor degree waves. If it doesn’t, your labeling is incorrect, regardless of the time or price magnitude.
Market Cycles and Their Influence
Tutor: Markets tend to move in cyclical patterns, influenced by economic factors, investor sentiment, and other forces. These cycles, often spanning years or even decades, can be broadly aligned with the larger-degree Elliott Wave patterns.
For example, a long-term economic expansion might correspond to a Supercycle or Cycle wave up, while a recession might coincide with a Cycle or Primary degree correction. Understanding where you are in the broader market cycle provides valuable context for your wave counts.
Learner: So, knowing the current market cycle helps me anticipate the likely direction and duration of future price movements?
Tutor: Precisely. It provides a “macro” backdrop against which to interpret the smaller-degree wave patterns. It’s not a crystal ball, of course, but it helps you understand the prevailing forces at play.
Combining Multiple Degrees: The Key to High-Probability Setups
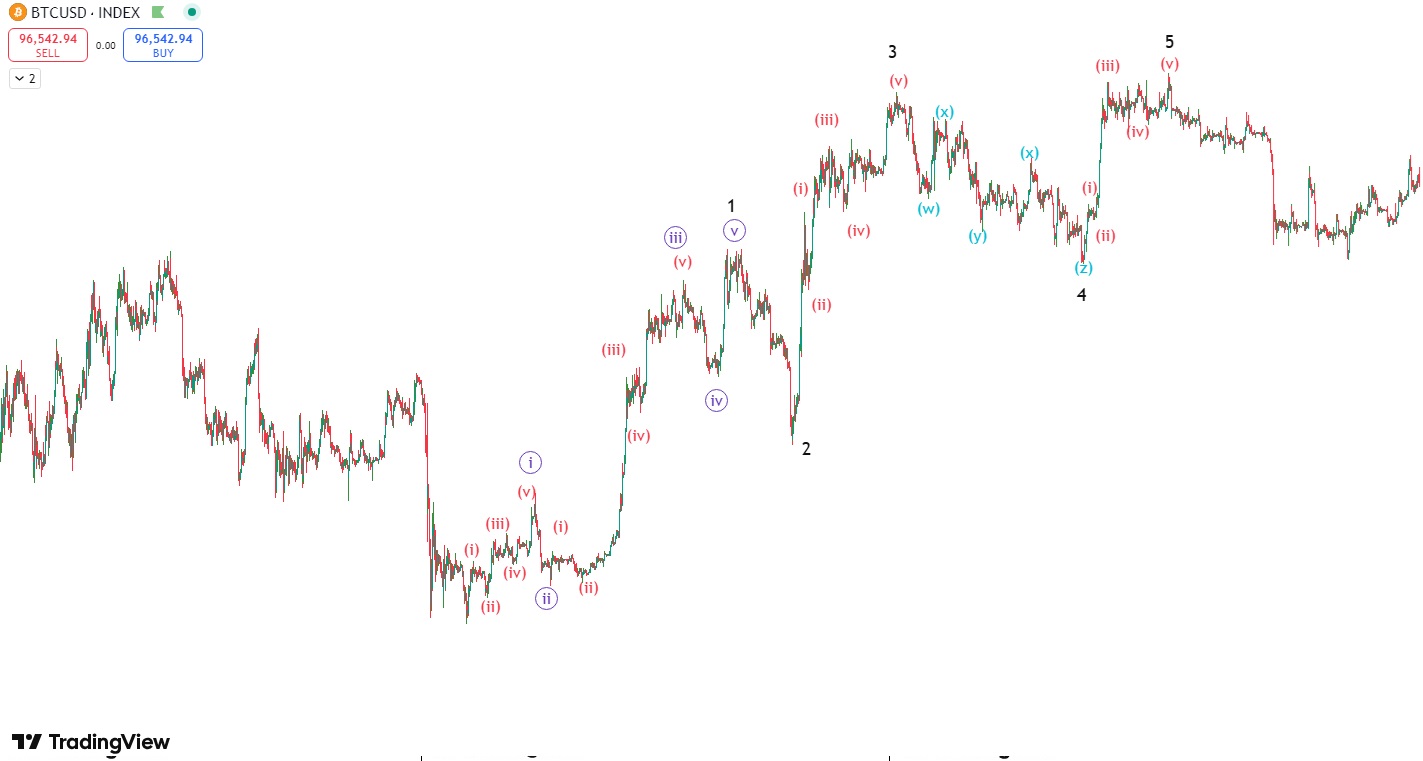
Tutor: The real power of Elliott Wave Theory lies in combining the analysis of multiple degrees. This is where you truly understand market structure. The goal is to identify situations where waves of different degrees are aligned, creating high-probability trading or investing opportunities.
Imagine you’ve identified a completed five-wave advance on a daily chart (let’s say, Intermediate degree). You then zoom in to the hourly chart and observe a potential five-wave decline developing (Minor degree). This could signal that the Intermediate degree advance is complete, and a larger correction is underway. The alignment of these two degrees – a completed impulse on the larger timeframe and a potential impulse in the opposite direction on the smaller timeframe – increases the probability of a successful trade.
Learner: It’s like finding confirmation from multiple sources, but the “sources” are the waves themselves.
Tutor: Exactly! You can also look for Fibonacci relationships between waves of different degrees. For instance, a Minor degree Wave 4 might retrace 50% of the preceding Minor degree Wave 3, and that entire Minor degree sequence might represent an Intermediate degree Wave 2, which retraces tipically 38.2% to 0.78 of the preceding Intermediate degree Wave 1. This convergence of Fibonacci levels across multiple degrees adds significant weight to your analysis.
Common Mistakes to Avoid
- Tunnel Vision: Focusing solely on one timeframe without considering the larger context.
- Mislabeling Wave Degrees: Incorrectly identifying the relative size and significance of waves.
- Ignoring Internal Structure: Failing to ensure that the internal structure of a wave conforms to Elliott Wave rules.
- Disregarding Market Cycles: Neglecting the influence of broader economic and market trends.
- Not Having Alternative Counts: Market might suprise you, you should always have different counts of a wave structure.
Summary of Key Points
- Market structure is about understanding the hierarchical relationship between waves of different sizes across multiple timeframes.
- Always start your analysis with the larger timeframe to establish the dominant trend.
- Use wave degrees to categorize waves and understand their relative significance.
- Consider market cycles to provide a “macro” context for your wave counts.
- Combine the analysis of multiple degrees to identify high-probability trading setups.
Final Takeaway
Mastering market structure within the framework of Elliott Wave Theory is a powerful skill that takes time, practice, and dedication. It’s about developing a multi-dimensional understanding of price movement, recognizing the fractal nature of markets, and learning to see the “forest” and the “trees.” By diligently studying the interplay of timeframes, wave degrees, and market cycles, you can significantly enhance your ability to anticipate market turns and make informed trading and investing decisions.