How Can Fibonacci Ratios Improve Your Elliott Wave Trading?

Learner: I keep hearing about Fibonacci ratios in trading, especially with Elliott Wave Theory. But honestly, it feels like magic numbers. How do Fibonacci numbers actually predict market movements? Is there real science behind it, or is it just another trading myth?
Tutor: That’s an excellent and very common question! It’s crucial to move beyond the “magic” perception and understand the underlying principles. Fibonacci ratios, when applied correctly within the Elliott Wave framework, aren’t about mystical predictions. They’re about identifying high-probability price levels based on observed market behavior and the mathematical relationships found throughout nature. They help quantify the likely extent of waves within a trend.
Let’s break down the “how” and “why” in detail. First, we need to revisit the Fibonacci sequence itself.
Learner: I know the basics – it starts with 0 and 1, and each subsequent number is the sum of the two preceding ones: 0, 1, 1, 2, 3, 5, 8, 13, 21, 34, 55, 89, 144, and so on. But how does that sequence translate to market prices?
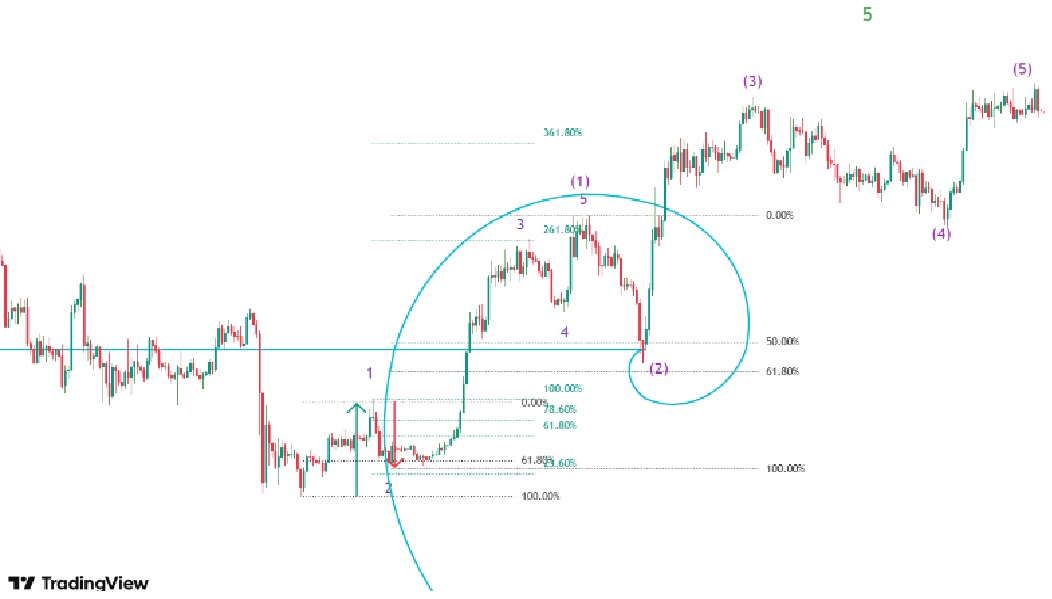
Tutor: The sequence itself isn’t directly applied to prices. It’s the ratios derived from this sequence that are crucial. As the sequence progresses, the ratio between consecutive numbers approaches the Golden Ratio, approximately 0.618 (or its inverse, 1.618). Other key ratios are derived by dividing numbers further apart in the sequence (e.g., a number divided by the number two places to its right approaches 0.382).
Here are the key Fibonacci ratios we use in Elliott Wave analysis:
- 0.236 (23.6%): A shallower retracement level.
- 0.382 (38.2%): A common retracement level, often seen in Wave 2 and Wave 4.
- 0.50 (50%): While not strictly a Fibonacci ratio, it’s a significant retracement level, often included in analysis.
- 0.618 (61.8%): The Golden Ratio, a very important retracement and extension level.
- 0.786 (78.6%): The square root of 0.618. Another strong retracement.
- 1.00 (100%): Represents a full retracement or a 1:1 extension.
- 1.272 (127.2%): The square root of 1.618. Common extension.
- 1.618 (161.8%): The Golden Ratio, used for extensions (often Wave 3 projections).
- 2.618 (261.8%): Another significant extension level, sometimes seen in extended Wave 3s or Wave 5s.
- 4.236 (423.6%): Used for extreme extensions.

Learner: So, we’re not just looking for these exact numbers on a price chart, right? We’re looking for areas around these percentages?
Tutor: Precisely. These ratios act as potential support and resistance zones. Think of them as magnets that tend to attract price action during retracements (in corrective waves) or extensions (in impulse waves). They provide probable turning points, not guaranteed ones.
Learner: Can you give a specific example of how these ratios are used within the Elliott Wave count?
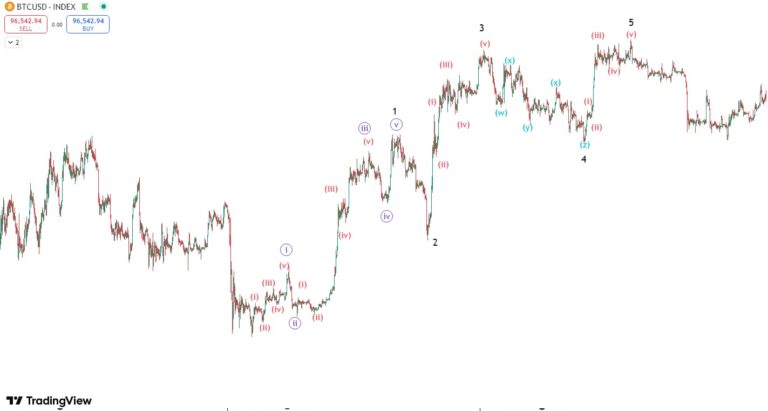
Tutor: Absolutely. Let’s consider a classic five-wave impulse pattern:
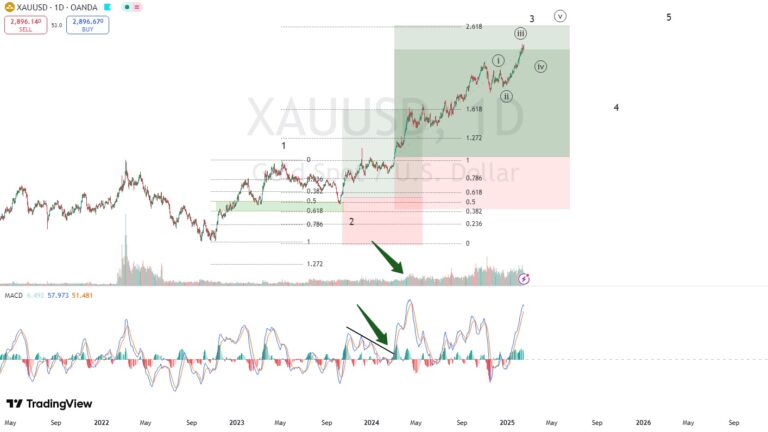
- Wave 2: Typically retraces a significant portion of Wave 1. Common Fibonacci retracement levels for Wave 2 are 0.382, 0.50, 0.618, and sometimes even 0.786. If Wave 2 retraces beyond the start of Wave 1, the wave count is invalidated.
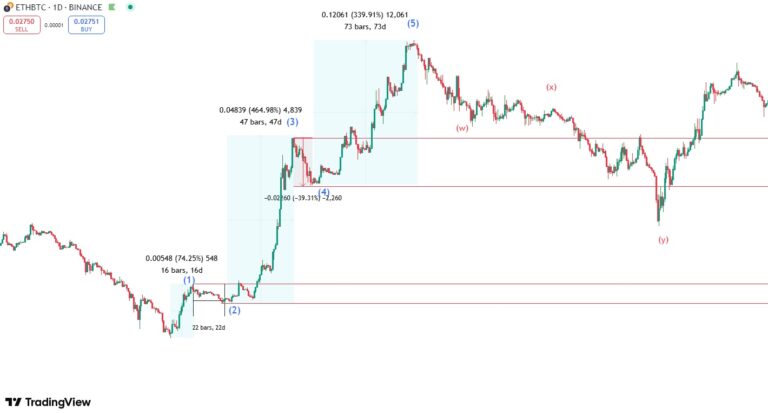
- Wave 3: Is usually the longest and strongest wave. We use Fibonacci extensions to project its potential target. Common extension levels for Wave 3 are 1.618, 2.618, and even 4.236 times the length of Wave 1.
- Wave 4: Is a corrective wave, typically shallower than Wave 2. Common retracement levels are 0.236, 0.382, and 0.50 of Wave 3. Wave 4 should not overlap with the price territory of Wave 1 (in most impulse waves).
- Wave 5: We can project Wave 5 using extensions of Wave 1, or by looking for equality with Wave 1 (a 1.00 extension). Other common ratios are 0.618 or 1.618 of the length from the start of Wave 1 to the end of wave 3.

Learner: So, we’re measuring the length of previous waves and then applying these ratios to project the potential length of the next wave?
Tutor: Exactly. We’re using the relationships within the wave structure itself to forecast likely price targets. It’s a dynamic process, and we constantly re-evaluate as the wave pattern unfolds.
Learner: What about corrective waves (A-B-C)? Do Fibonacci ratios apply there too?
Tutor: Yes, they do. In corrective patterns, Fibonacci retracements are used to analyze the relationship between waves A, B, and C. For example:
- Wave B: Often retraces a portion of Wave A. Common levels are 0.382, 0.50, and 0.618 of Wave A.
- Wave C: Can be projected using extensions of Wave A. Common levels are 1.00 (equality with Wave A), 1.272, and 1.618 of Wave A.

Learner: This is starting to make more sense. But what if the price doesn’t hit these Fibonacci levels exactly?
Tutor: That’s a crucial point. Fibonacci levels are zones of probability, not precise points. The market rarely hits these numbers to the penny. We look for confluence – areas where multiple Fibonacci levels from different waves cluster together. This strengthens the likelihood of a reaction.
Learner: Confluence? Can you explain that further?
Tutor: Confluence means that several Fibonacci levels, derived from different measurements within the wave structure, coincide in a relatively narrow price range. For instance, you might find that the 0.618 retracement of Wave 1 aligns closely with the 1.618 extension of Wave A (within a corrective pattern). This convergence creates a stronger potential support or resistance zone.
Learner: So, the more Fibonacci levels that align, the higher the probability of a market reaction in that area?
Tutor: Precisely. It’s like having multiple confirmations from different sources, increasing the reliability of the analysis.
Learner: Are there any common mistakes traders make when using Fibonacci ratios?
Tutor: Yes, several:
- Using Fibonacci in isolation: Fibonacci ratios should be used in conjunction with other technical analysis tools, such as trendlines, candlestick patterns, volume analysis, and momentum indicators (like RSI or MACD).
- Forcing the ratios to fit: Sometimes, traders try to “force” the market to fit their preconceived Fibonacci levels. It’s important to be objective and let the market guide the analysis.
- Ignoring the larger context: Always consider the broader market trend and the overall Elliott Wave count.
- Expecting precision: Remember, these are zones, not exact price points.
- Not using stop-loss orders: Even with confluence, there’s no guarantee. Always manage risk with appropriate stop-loss orders.

Learner: This has been incredibly helpful. It’s clear that Fibonacci ratios are powerful tools, but they require careful application and a deep understanding of the Elliott Wave principle.
Tutor: You’ve got it. The key is to view Fibonacci ratios as probabilistic guidelines within a larger framework. They help us quantify the inherent order and rhythm found in market movements, reflecting the underlying psychology of market participants. Remember, they are most effective when combined with other forms of analysis and a solid understanding of Elliott Wave patterns. Always prioritize risk management and maintain a flexible, adaptive approach.
Learner: Any final pieces of advice?
Tutor: Practice, practice, practice. Start by identifying Fibonacci retracements and extensions on historical charts. Then, gradually incorporate them into your live trading, always starting with small positions and managing risk carefully. The more you work with these ratios, the more intuitive they will become. And remember, context is king. Don’t just look for the numbers; understand the why behind them.