Wave 1 – Unveiling the Market’s Initial Movement
Learner: I would like to truly understand Wave 1. Could you walk me through its deeper significance in market analysis?
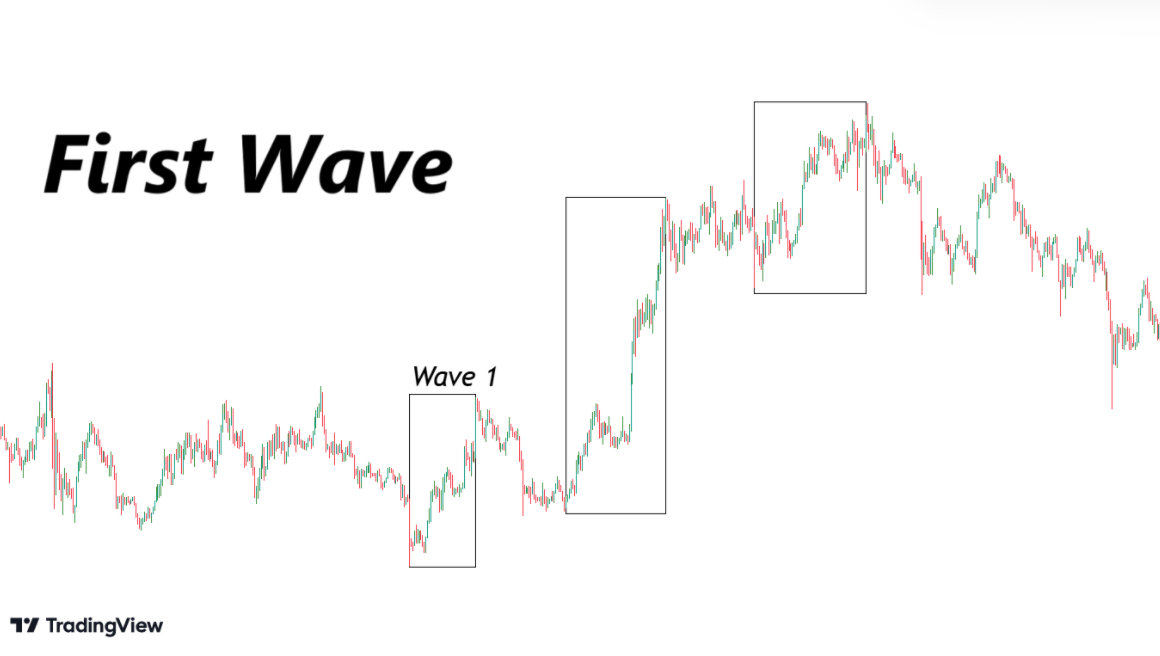
Tutor: Wave 1 is far more than a simple price movement. It’s the foundational breath of a potential market trend, representing the first subtle yet critical indication of a possible directional change. Understanding Wave 1 requires a nuanced approach that combines technical analysis with market psychology.
Learner: What makes Wave 1 so unique in the Elliott Wave pattern?
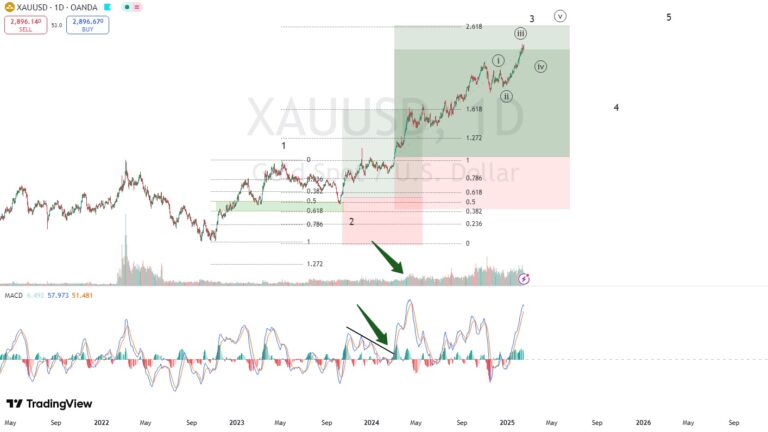
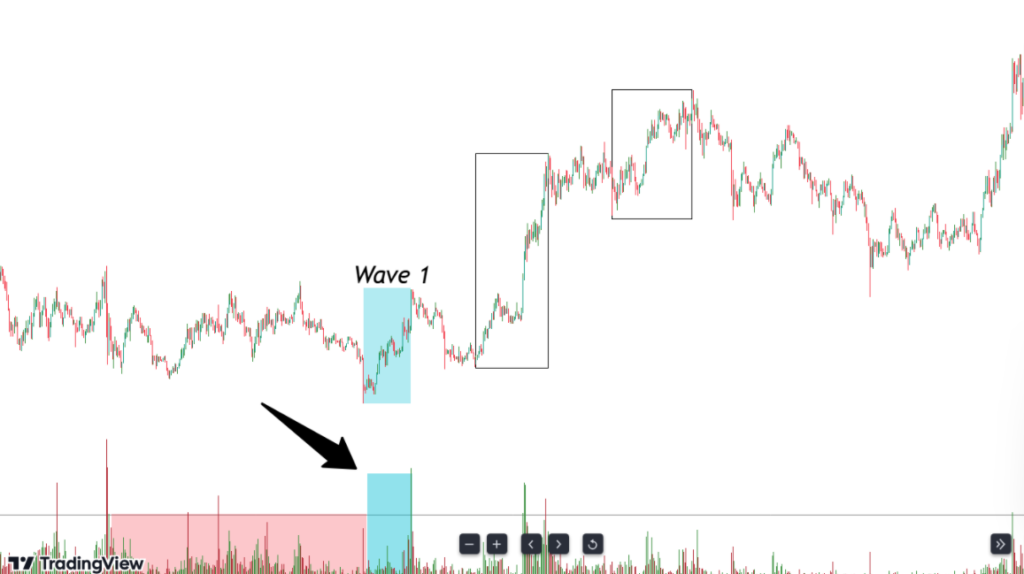
Tutor: Unlike later waves, Wave 1 emerges in an environment of maximum uncertainty. Most market participants are still committed to the previous trend, creating a perfect breeding ground for a contrarian movement. During the first wave, a positive volume shift is easily seen since it is above many previously printed bars. Wave 1 may not seem obvious all the time due to previous price fluctuation, yet it carries immense strategic importance.
Learner: How do professional analysts actually identify Wave 1?
Tutor: Identification is both an art and a science. We look for several key indicators:
- A clear break from the previous trend’s price structure
- Initial momentum that suggests a potential directional change
- Subtle but distinct price movement
- Emerging volume patterns that differ from previous market behavior
The challenge lies in distinguishing Wave 1 from mere market noise. It requires a combination of technical indicators, volume analysis, and a deep understanding of market psychology.
Learner: What technical tools are most effective in identifying Wave 1?
Tutor: Multiple tools provide insights:
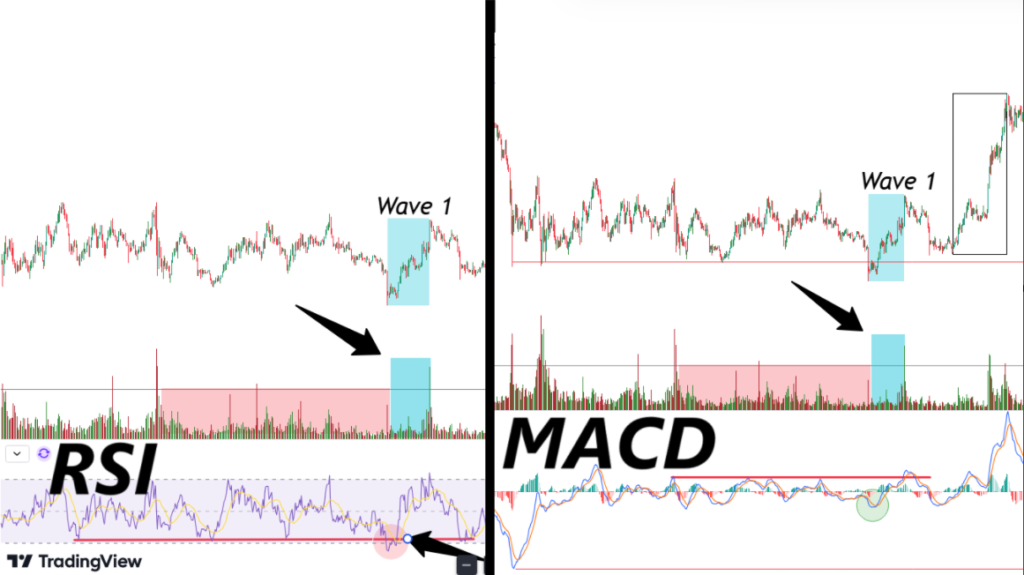
- Moving Average Convergence Divergence (MACD)
- Relative Strength Index (RSI)
- Volume profile analysis
- Trend line and support/resistance level breaks
- Technical Divergence Analysis
Learner: Each tool offers a different perspective. The MACD, for instance, helps identify momentum shifts, while volume profile reveals the underlying market structure and participant behavior.
Learner: What exactly is technical divergence?
Tutor: Divergence is a powerful analytical technique that reveals potential trend reversals by comparing price action with momentum indicators. It occurs when the price of an asset moves in one direction, while the momentum indicator moves in the opposite direction, signaling a potential weakness in the current trend.
There are two primary types of divergence:
- Regular Divergence:
- Bullish Regular Divergence: Price makes lower lows, but the indicator makes higher lows
- Bearish Regular Divergence: Price makes higher highs, but the indicator makes lower highs
- Hidden Divergence:
- Bullish Hidden Divergence: Price makes higher lows, but the indicator makes lower lows
- Bearish Hidden Divergence: Price makes lower highs, but the indicator makes higher highs
In the context of Wave 1, divergence can be a critical early warning system. It helps traders identify potential trend reversals before they become obvious to the broader market. The most commonly used indicators for divergence analysis include MACD, RSI, and Stochastic Oscillator shifts, while volume profile reveals the underlying market structure and participant behavior.
Learner: How do Fibonacci ratios play into Wave 1 analysis?
Tutor: Fibonacci relationships are crucial in understanding Wave 1’s potential price movements. Let me break this down systematically.
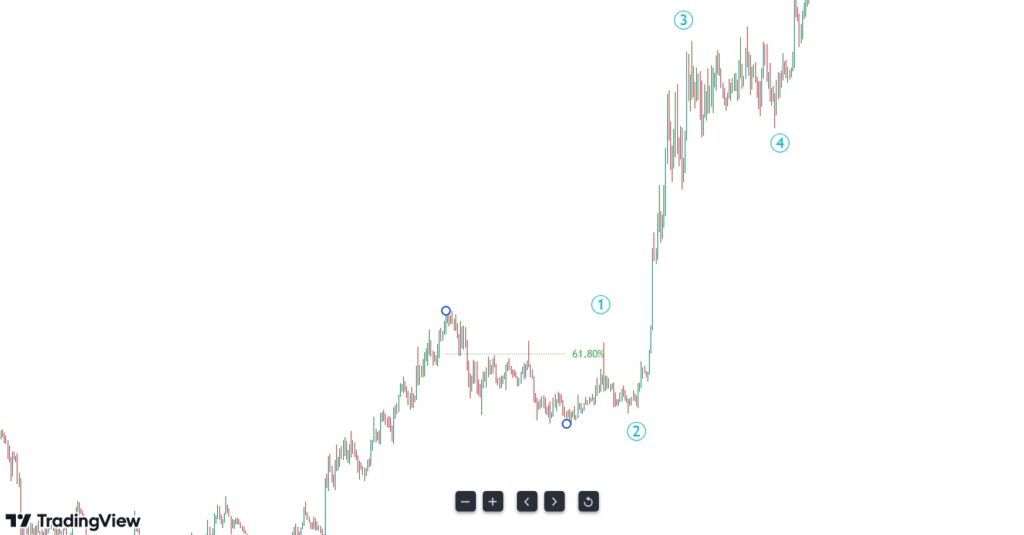
When we discuss Fibonacci retracement levels in Wave 1, we’re essentially mapping potential price targets based on the previous trend’s magnitude. Imagine the market as a rubber band – Wave 1 stretches away from the previous trend’s endpoint, and Fibonacci ratios help us predict how far this stretch might reasonably go.
Here’s what 0.618 and 1.0 actually mean:
0.618 (Golden Ratio) represents a 61.8% extension of the previous trend’s price movement. If the prior downtrend ended at $10, and Wave 1 starts moving up, it might reach around $16.18 – representing a 61.8% increase from the previous low.
1.0 represents a 100% extension, meaning the Wave 1 movement could potentially match the full length of the previous trend. In our example, this would be a price around $20.
These aren’t hard rules, but probabilistic guidelines. They reflect a mathematical relationship found throughout nature – the same proportion seen in spiral shells, flower petals, and galaxy formations – now observed in market movements.
Learner: Why these specific numbers?
Tutor: The Fibonacci sequence isn’t arbitrary. It’s a mathematical pattern where each number is the sum of two preceding ones (0, 1, 1, 2, 3, 5, 8, 13…). The ratios we use – like 0.618 – emerge from dividing consecutive Fibonacci numbers, such us 3/2, 8/5, or 13/8… This ratio appears repeatedly in natural systems, suggesting an underlying mathematical harmony that somehow reflects market psychology.
Learner: Could you elaborate on the psychological aspects of Wave 1?
Tutor: Wave 1 is fundamentally a psychological phenomenon. It represents the first inklings of a market sentiment shift. At this stage, only the most forward-thinking and risk-tolerant investors begin to take positions. They’re typically institutional traders, sophisticated individual investors, and market professionals who can identify early trend potential.
These early participants are essentially testing the market’s resolve. Their actions create a small but significant momentum that may attract additional investors if the trend gains credibility.
Learner: What are the most common misinterpretations of Wave 1?
Tutor: Several critical misconceptions plague Wave 1 analysis:
- Mistaking temporary price fluctuations for a genuine trend
- Overestimating the initial movement’s significance
- Failing to confirm the wave’s technical validity
- Ignoring the broader market context
The key is maintaining a balanced perspective. Wave 1 is a potential beginning, not a guaranteed trend continuation.
Learner: How does Wave 1 differ in various market conditions?
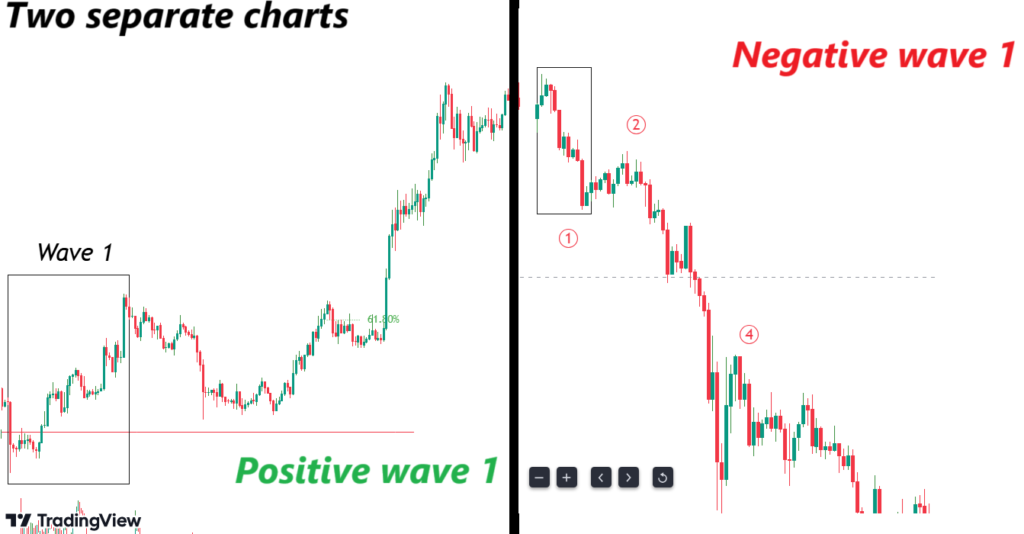
Tutor: While the fundamental principles remain consistent, Wave 1 manifests differently in bull and bear markets. In a bullish scenario, it represents an initial upward movement after a prolonged downtrend. In a bearish market, it signals the first downward momentum after a previous uptrend.
The critical aspect is understanding the contextual market environment and recognizing the nuanced indicators of potential trend reversal.
Learner: What advanced techniques can improve Wave 1 identification?
Tutor: Advanced traders employ multi-timeframe analysis, combining daily, weekly, and monthly charts to validate Wave 1 formations. Cross-referencing different timeframes helps confirm the wave’s authenticity and provides a more comprehensive market perspective.
Additionally, correlating Wave 1 analysis with broader market indicators like sector performance, economic indicators, and global market trends enhances predictive accuracy.
Key Insights:
- Wave 1 represents the initial market trend movement
- Characterized by low confidence and limited participation
- Requires sophisticated, multi-dimensional analysis
- Critical for identifying potential trend reversals.